Small home? Big potential.
Read the Tips 


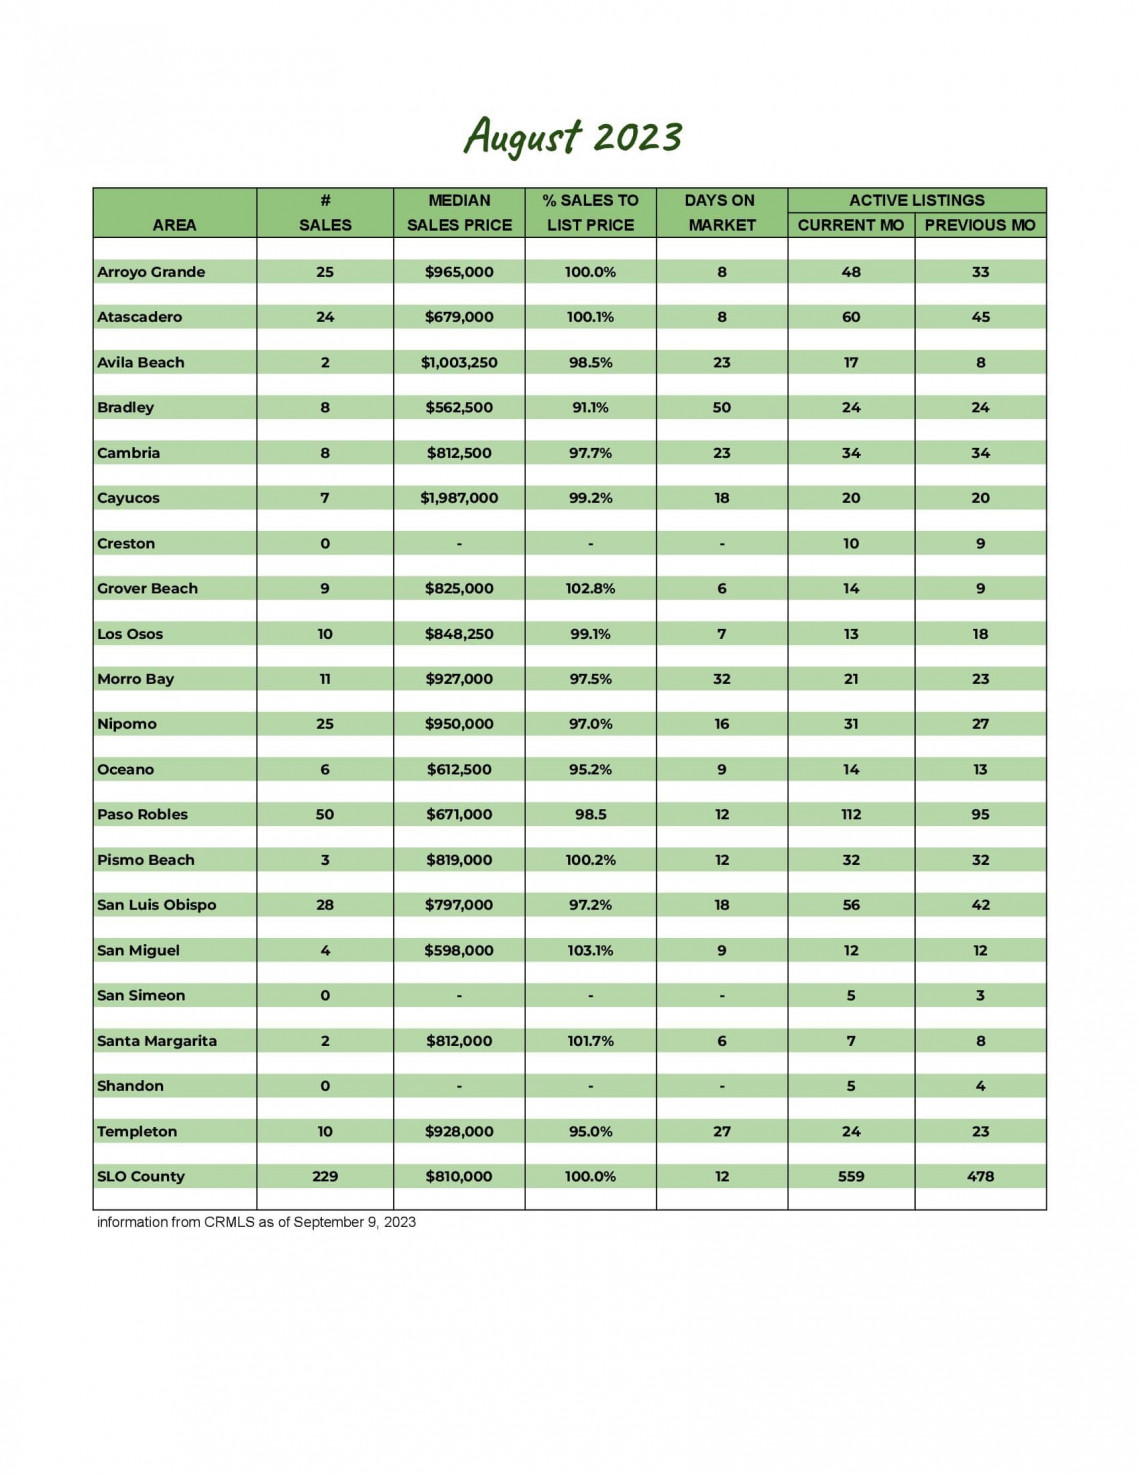
San Luis Obispo County August 2023 Market Update
Whether you're thinking of buying or selling a home, or just like to stay up to date on the real estate market, you need locally sourced, real data to keep you informed.
Knowing the most important data such as the average sales price, number of homes sold, and days on market will better prepare you for your real estate transaction.
While the August average sales price is up .97% from last month, the median sales price is down 1.81% from July. The number of new listings, pending, and closed sales are down from last month. Current inventory is up from last month but down from August of last year.
The average days on the market is up a day from last month's 32 days, but well over half of the closed sales were on the market for less than 14 days. The average percentage of the sales price to list price dipped to 97.6%, yet more than half of the sales sold for the list price or more.
Our market report showcases everything you need to know about each San Luis Obispo County community's real estate trends.
288
New Listings
2022: 302
559
Active Listings
2022: 626
170
Under Contract
2022: 233
229
Closed Sales
2022: 281
Homes Sold
97.6%
Sale-to-List Price
2022: 96.6%

$956,500
Avg Sales Price
2022: $944,764

2.8
Months of Supply
2022: 2.3

33
Avg Days on Market
2022: 26

$499
Avg Price per Sq Foot
2022: $528