San Luis Obispo County Market Report
August 2022
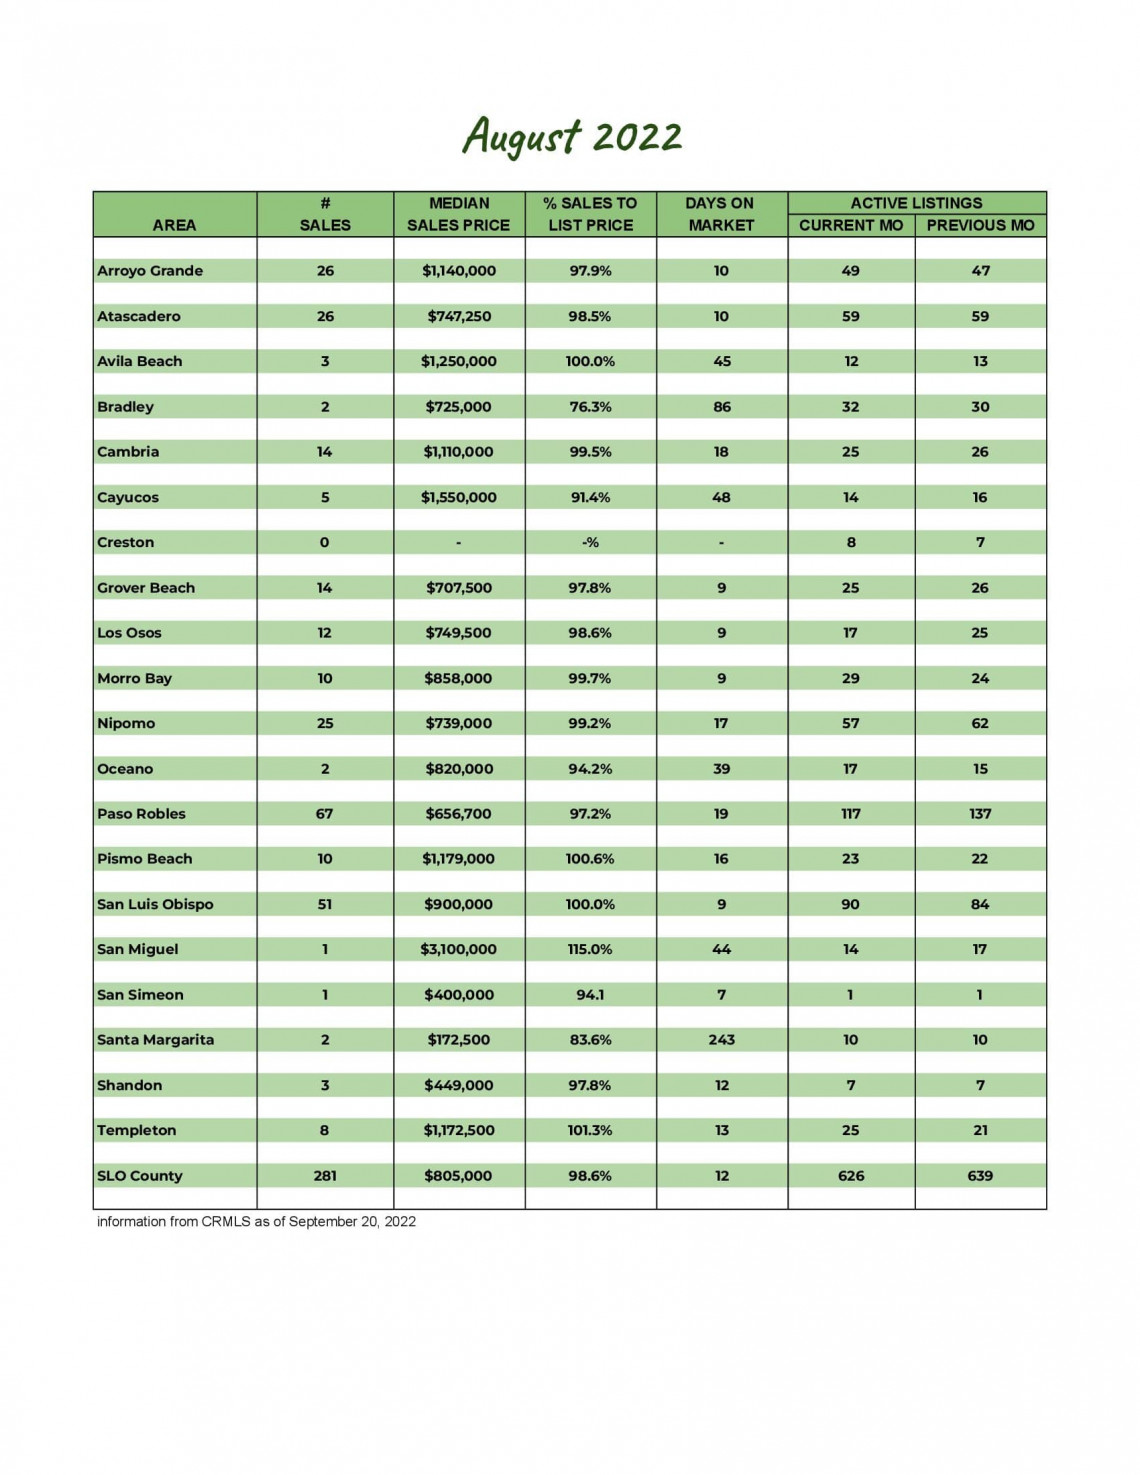
August 2022
If you’re curious about the real estate market, it's good to have a clear understanding of what’s going on in your local market. Yes, national headlines matter, but they don't always reflect what's going on locally.
For the first time since March 2021, the average sales price to list price ratio fell below 100% to a more pre-pandemic average of 96.6%. Does this mean the market is crashing? No, but home prices are resetting. Knowing the most important data such as the average sales price, the number of homes sold, and days on market will better prepare you to buy or sell a home.
Our market report showcases everything you need to know about San Luis Obispo County's local real estate trends.
New Listings
Active Listings
Under Contract
Closed Sales
Average Sales Price
Average Days on Market
Average Price Per Square Foot
Months of Supply