Small home? Big potential.
Read the Tips 


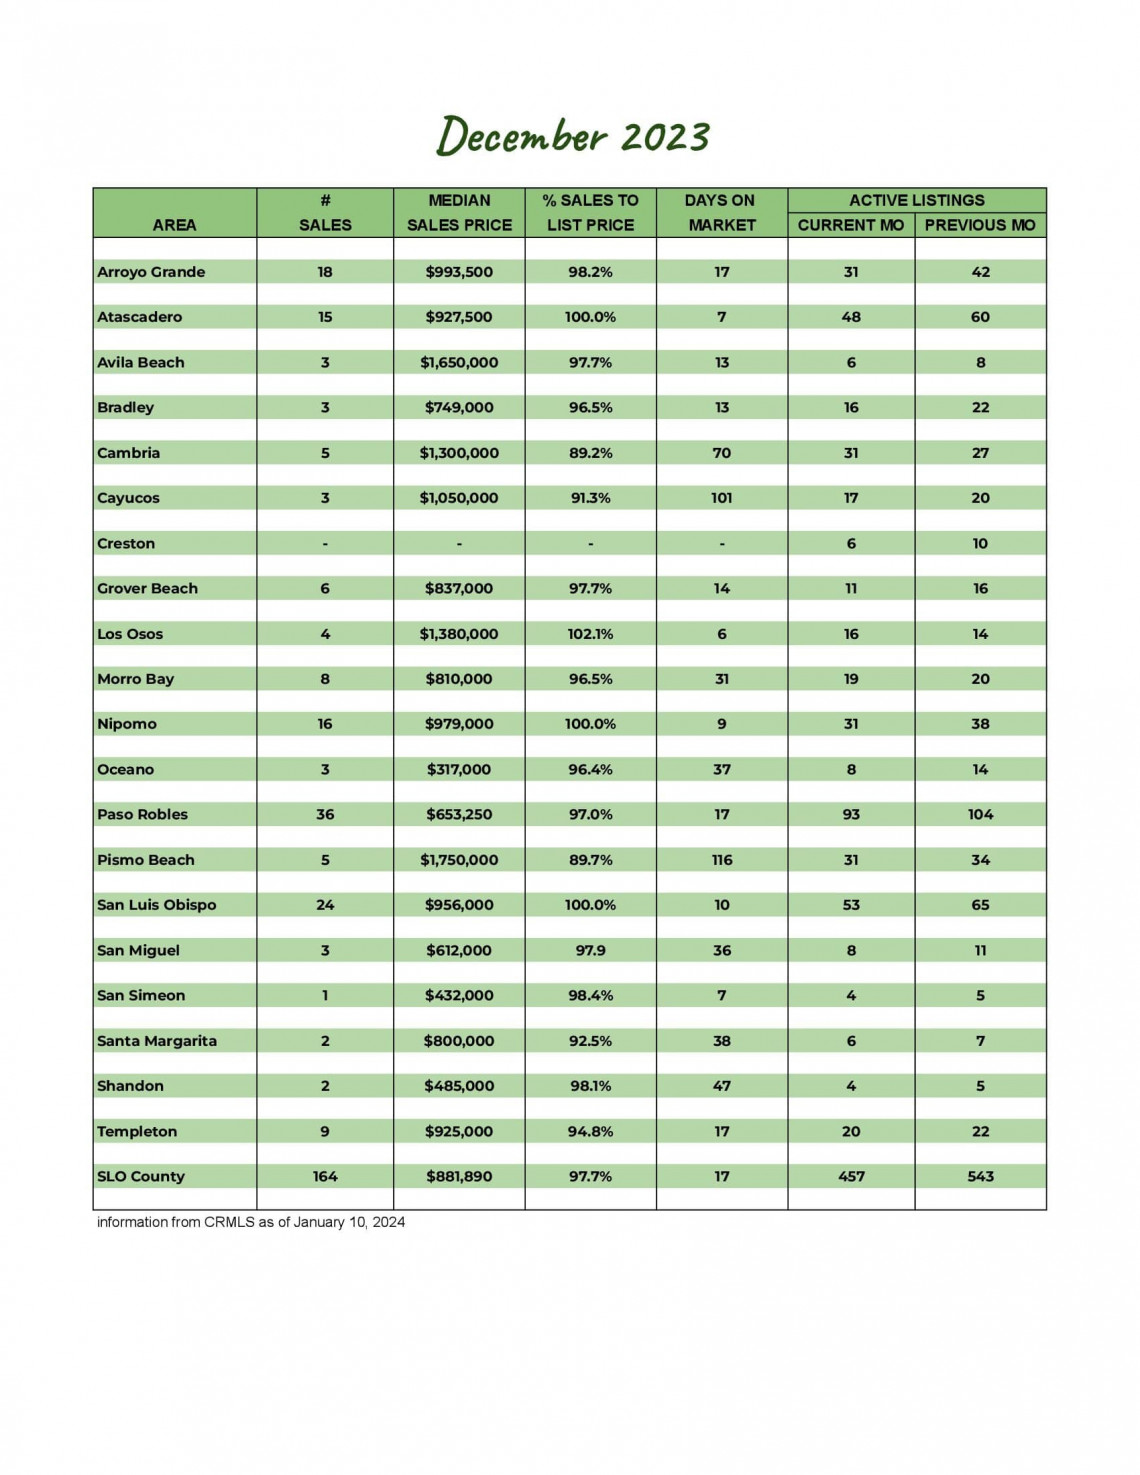
San Luis Obispo County December 2023 Market Update
Whether you're thinking of buying or selling a home, or just like to stay up to date on the real estate market, you need real data that is locally sourced to keep you informed.
Knowing the most important data such as the average sales price, number of homes sold, and days on market will better prepare you for your real estate transaction.
Hitting an all-time low, there were only 113 new listings in December. That's a 17.5% drop from last year and 41.5% from last month, significantly higher than the seasonal averages of the past few years. The number of pending sales are 14.9% down from last year, while closed sales are nearly the same. and both are virtually the same as last month. The number of active listings dropped 15.8% while the average number of days on market increased 27.6% from last month,
The average price is up 9.0% from last year. The average percentage of the sales price to list price slipped to 96.8%, as 62.2% of the homes sold for less than the list price.
Our market report showcases everything you need to know about each San Luis Obispo County community's real estate trends.
113
New Listings
2022: 137
457
Active Listings
2022: 520
114
Under Contract
2022: 131
164
Closed Sales
2022: 168
Homes Sold
96.3%
Sale-to-List Price
2022: 94.9%

$1,022,392
Avg Sales Price
2022: $938,221

2.3
Months of Supply
2022: 2.2

37
Avg Days on Market
2022: 40

$550
Avg Price per Sq Foot
2022: $511