Summer buyers are motivated. Here's what that means for your listing.
Read the Post 


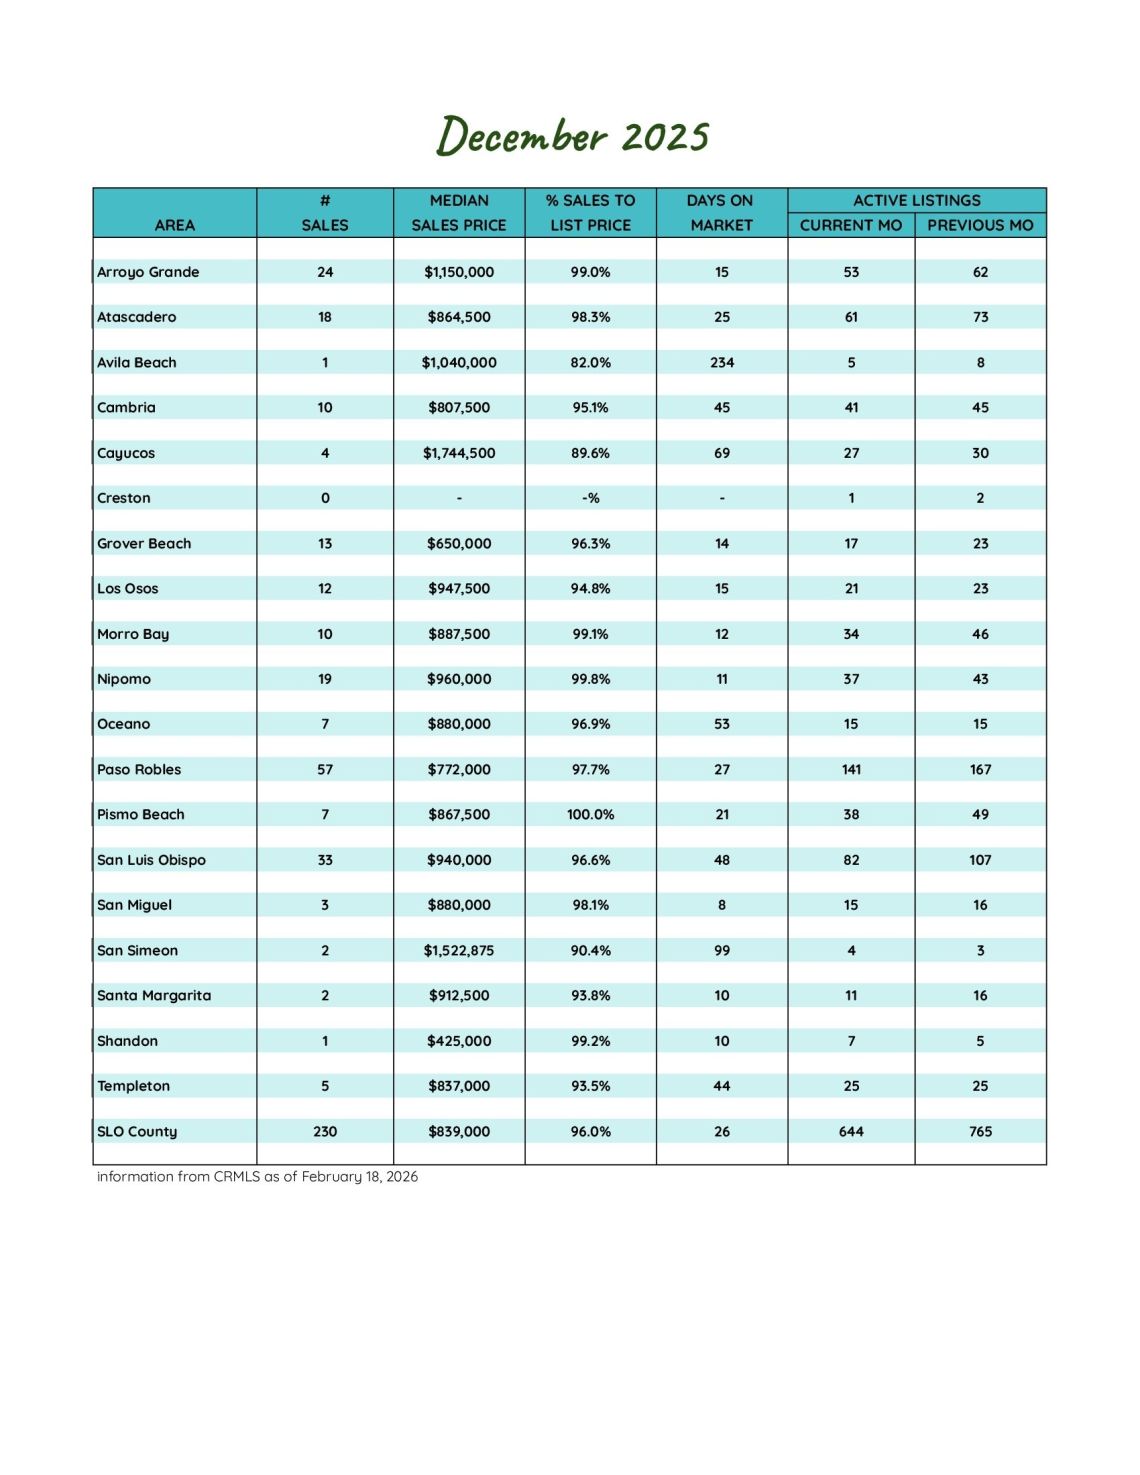
San Luis Obispo County December 2025 Market Update
Year Ends with Tightening Inventory, Strong Closings, and Softer Pricing Trends
As 2025 comes to a close, the San Luis Obispo County housing market reflects a seasonal slowdown paired with notable strength in closed sales. December’s data shows fewer new listings, tightening inventory, and a surge in year-end closings, while pricing metrics indicate slight softening as buyers gain negotiating leverage.
Inventory Trends: Fewer New Listings, Supply Contracts
New listings declined in December to 161 homes, down 16.6% from November’s 193 but up 13.4% compared to December 2024’s 142. Active listings dropped sharply to 644, a 17.0% decrease month-over-month and slightly below last year’s 652.
With months of supply falling to 2.9 from 3.6 in November, inventory tightened significantly, creating a more competitive environment than seen in the prior months.
Sales Activity: Closings Surge Despite Fewer Pendings
Buyer activity showed mixed signals. Pending sales dipped to 172, down 8.0% from November but up 33.3% from a year ago. Meanwhile, closed sales surged to 230, a 25.7% jump from November and 16.8% higher year-over-year, reflecting strong follow-through from earlier contracts.
Roughly 26% of homes sold above list price, and nearly 25% went under contract within 10 days, demonstrating that well-priced homes continue to attract strong demand.
Pricing and Market Pace: Buyers Gain Some Ground
Pricing softened slightly in December. The average sales price declined to $1,018,289, down 0.4% month-over-month and 7.3% compared to last year. Price per square foot fell to $558, also down both monthly and annually.
The list-to-sale price ratio improved slightly to 95.5%, though it remains below last year’s level, signaling continued buyer leverage. Homes spent an average of 55 days on market, a modest increase from both November and last December, reflecting a more measured pace.
Luxury and Community Highlights
Luxury activity remained a key component of the market, with 14 sales exceeding $2,000,000 and a top sale of $3,580,000. Four communities maintained average sales prices above $1 million, while two remained below $750,000, highlighting the wide range of price points across the county.
What It Means for Buyers and Sellers
For sellers, reduced inventory creates opportunity, but pricing strategy remains critical as buyers become more selective. Homes that are well-prepared and competitively priced are still selling quickly—and sometimes above asking.
For buyers, increased negotiating power compared to last year, combined with slightly softer pricing, offers a window of opportunity, even as limited inventory keeps competition alive for desirable properties.
As the market transitions into 2026, conditions point toward a balanced but tightening landscape—less frenetic than peak periods, yet still active and opportunity-driven for both sides.
161
New Listings
2024: 142
644
Active Listings
2024: 652
172
Under Contract
2024: 129
230
Closed Sales
2024: 197
Homes Sold
95.5%
Sale-to-List Price
2024: 96.8%

$1,018,289
Avg Sales Price
2024: $1,098,486

2.9
Months of Supply
2024: 3.0

55
Avg Days on Market
2024: 54

$558
Avg Price per Sq Foot
2024: $576