Summer buyers are motivated. Here's what that means for your listing.
Read the Post 


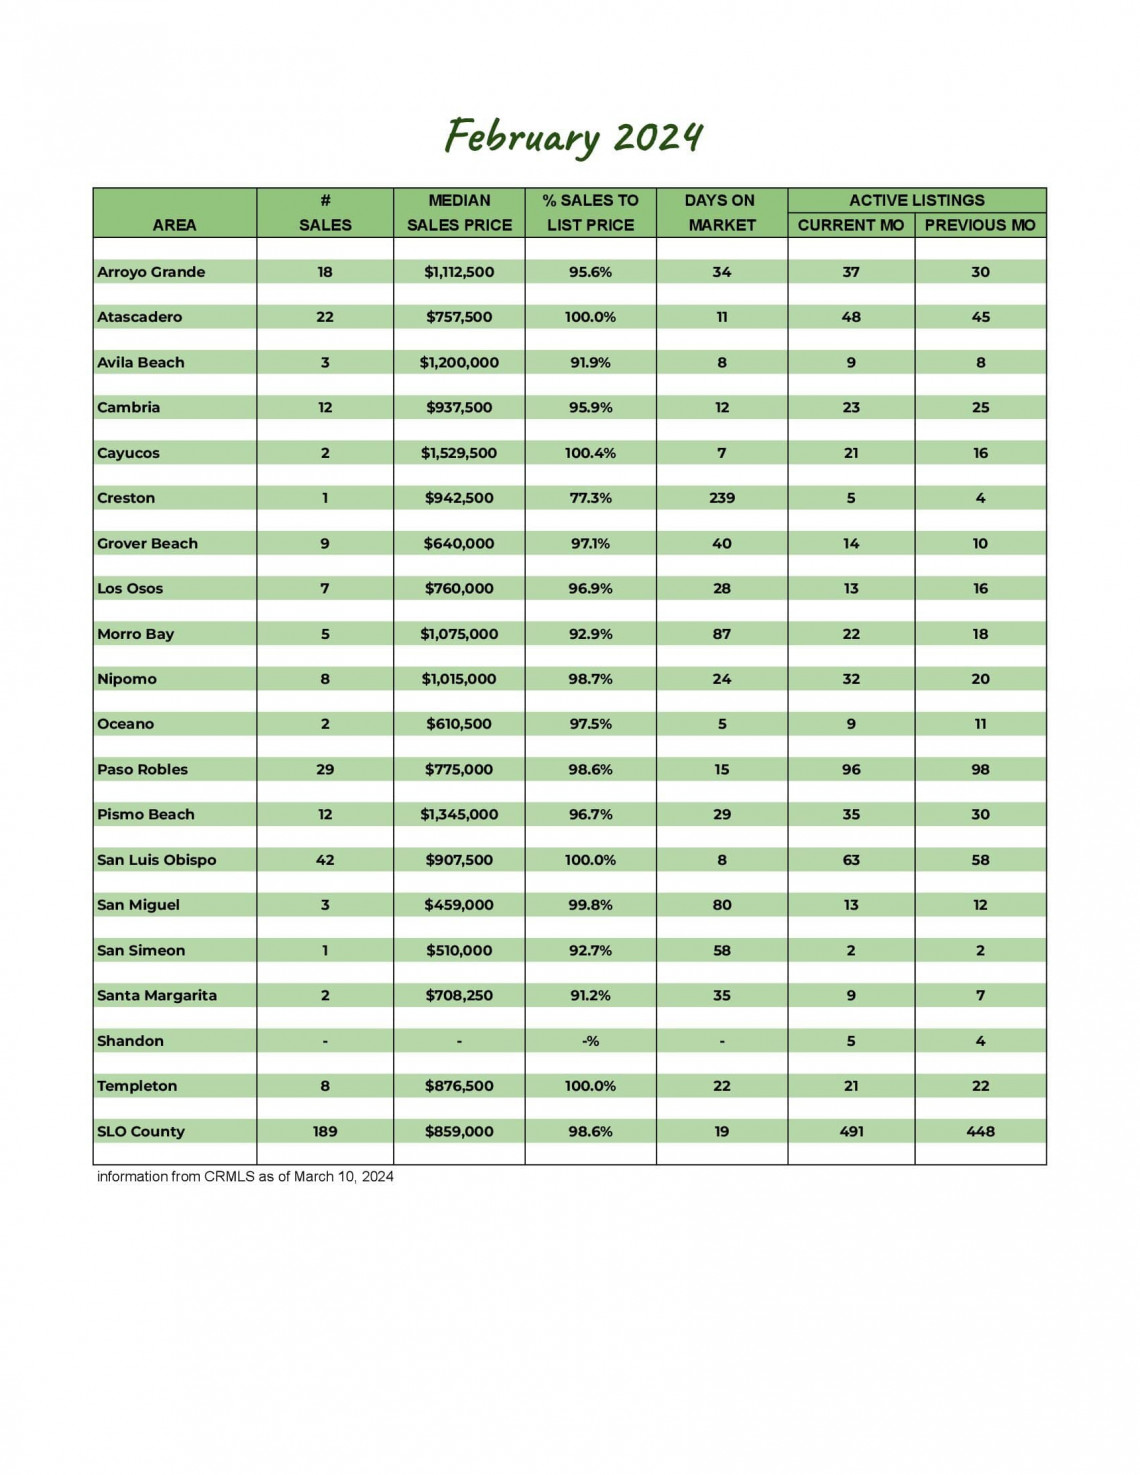
San Luis Obispo County February 2024 Market Update
Whether you're thinking of buying or selling a home, or just like to stay up to date on the real estate market, you need real data that is locally sourced to keep you informed.
Knowing the most important data such as the average sales price, number of homes sold, and days on market will better prepare you for your real estate transaction.
February 2024 saw 189 closed sales, up 26.8% from last year's 149 sales. New listings this year saw an increase of 11.6% from last year. Pending sales are down over 17.6% from last month and February 2023. Inventory remains under 500 homes which is up from last month but flat from last year
The average price is up 11.4% from last year, while the average price per square foot is up 7.8%. The average percentage of the sales price to list price dipped to 96.9%, as 55.6% of the homes sold for less than the list price.
Our market report showcases everything you need to know about each San Luis Obispo County community's real estate trends.
240
New Listings
2023: 215
491
Active Listings
2023: 482
164
Under Contract
2023: 199
189
Closed Sales
2023: 149
Homes Sold
96.9%
Sale-to-List Price
2023: 96.1%

$1,004,979
Avg Sales Price
2023: $901,840

2.4
Months of Supply
2023: 2.1

43
Avg Days on Market
2023: 47

$568
Avg Price per Sq Foot
2023: $527