Small home? Big potential.
Read the Tips 


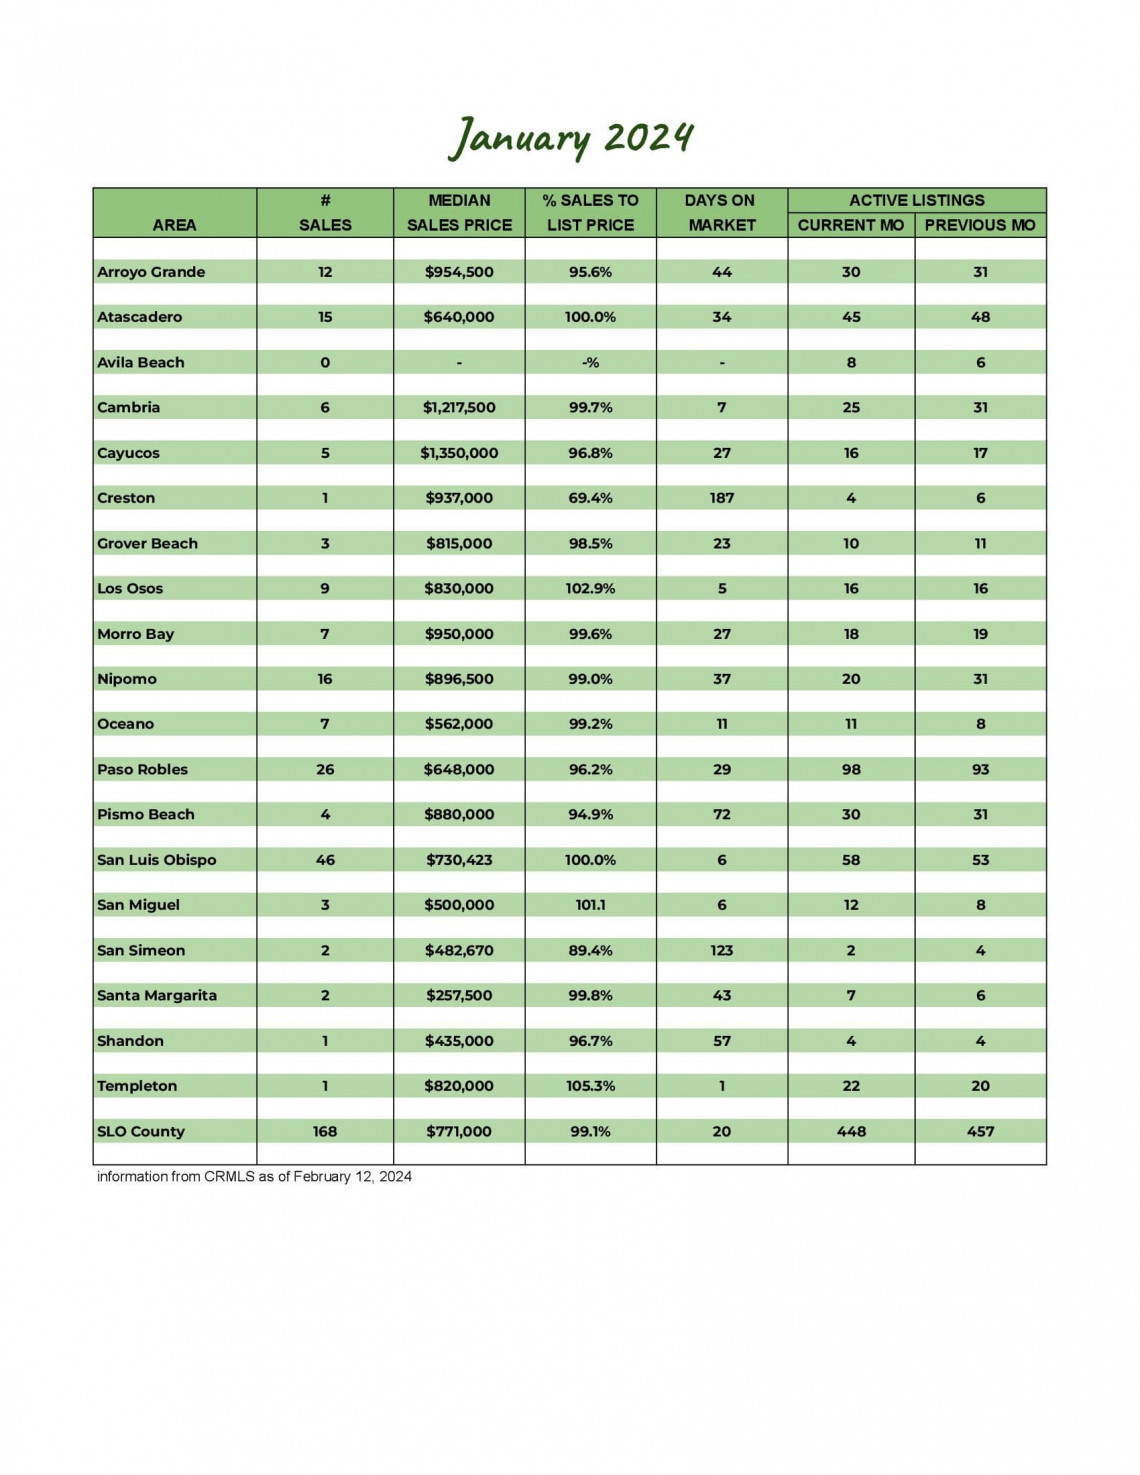
San Luis Obispo County January 2024 Market Update
Whether you're thinking of buying or selling a home, or just like to stay up to date on the real estate market, you need real data that is locally sourced to keep you informed.
Knowing the most important data such as the average sales price, number of homes sold, and days on market will better prepare you for your real estate transaction.
January 2024 saw 168 closed sales, up 43.6% from last year's 117 sales. New listings this year saw an increase of 12.4% from last year. They didn't stay on the market for long as pending sales also saw a 12.9% increase. While inventory remained the same as last month, it's down 11.6% from January 2023.
The average price is down 3.7% from last year, yet the average price per square foot is up 12.8% from last year. The average percentage of the sales price to list price is up to 97.1%, as 45.8% of the homes sold for list price or above.
Our market report showcases everything you need to know about each San Luis Obispo County community's real estate trends.
217
New Listings
2022: 193
448
Active Listings
2022: 507
184
Under Contract
2022: 163
168
Closed Sales
2022: 117
Homes Sold
97.1%
Sale-to-List Price
2022: 95.5%

$868,295
Avg Sales Price
2022: $901,606

2.2
Months of Supply
2022: 2.2

36
Avg Days on Market
2022: 44

$556
Avg Price per Sq Foot
2022: $493