Summer buyers are motivated. Here's what that means for your listing.
Read the Post 


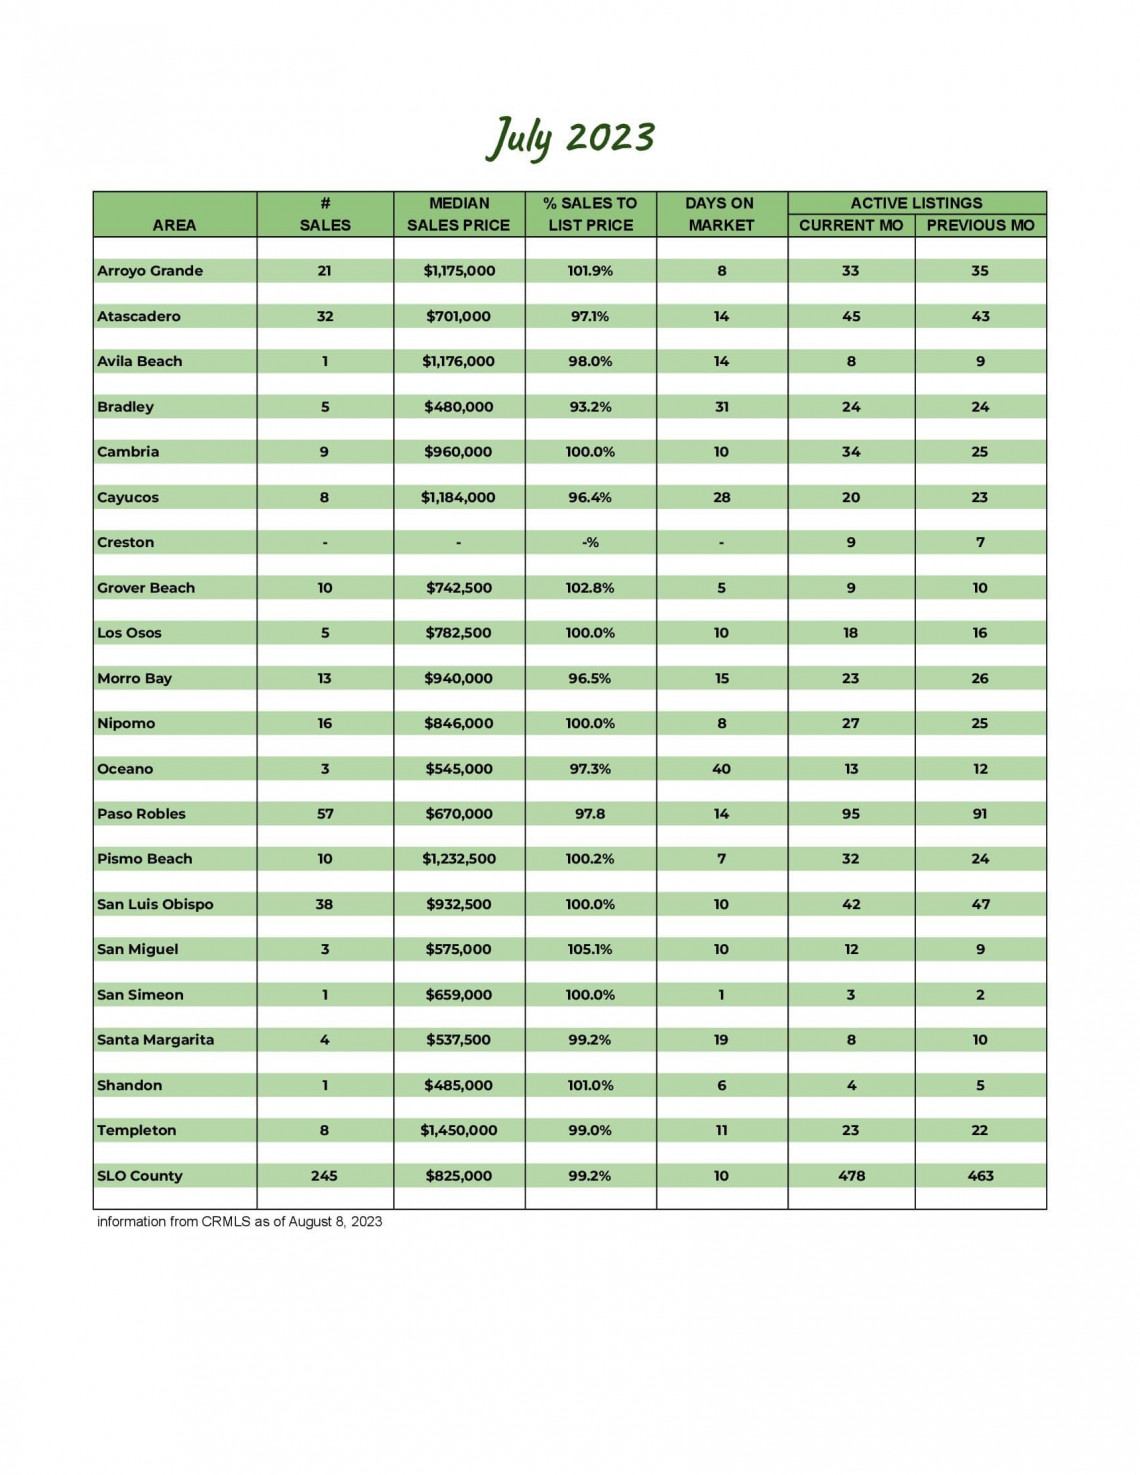
San Luis Obispo County July 2023 Market Update
Locally sourced, real data is key when you are thinking of buying or selling a home, or even if you just like to stay up to date on the real estate market.
Knowing the most important data such as the average sales price, number of homes sold, and days on market will better prepare you to sell your home.
While the July average sales price is down 5.76% from last month, it is up .78% from July of last year. The number of new listings, pending sales, and closed sales are holding steady with minimal change from last month, leaving active inventory unchanged.
The average days on the market increased a few days from last month, but more than half of the closed sales were on the market for less than 14 days. The average percentage of the sales price to list price dipped to 98.4%, while about half of the sales sold for the list price or more.
Our market report showcases everything you need to know about each San Luis Obispo County community's real estate trends.
247
New Listings
2022: 347
478
Active Listings
2022: 694
181
Under Contract
2022: 265
245
Closed Sales
2022: 273
Homes Sold
98.4%
Sale-to-List Price
2022: 99.6%

$947,307
Avg Sales Price
2022: $939,866

2.4
Months of Supply
2022: 2.5

32
Avg Days on Market
2022: 18

$552
Avg Price per Sq Foot
2022: $541