Selling a home you've lived in for decades? Here's what's different about the process.
Read the Post 


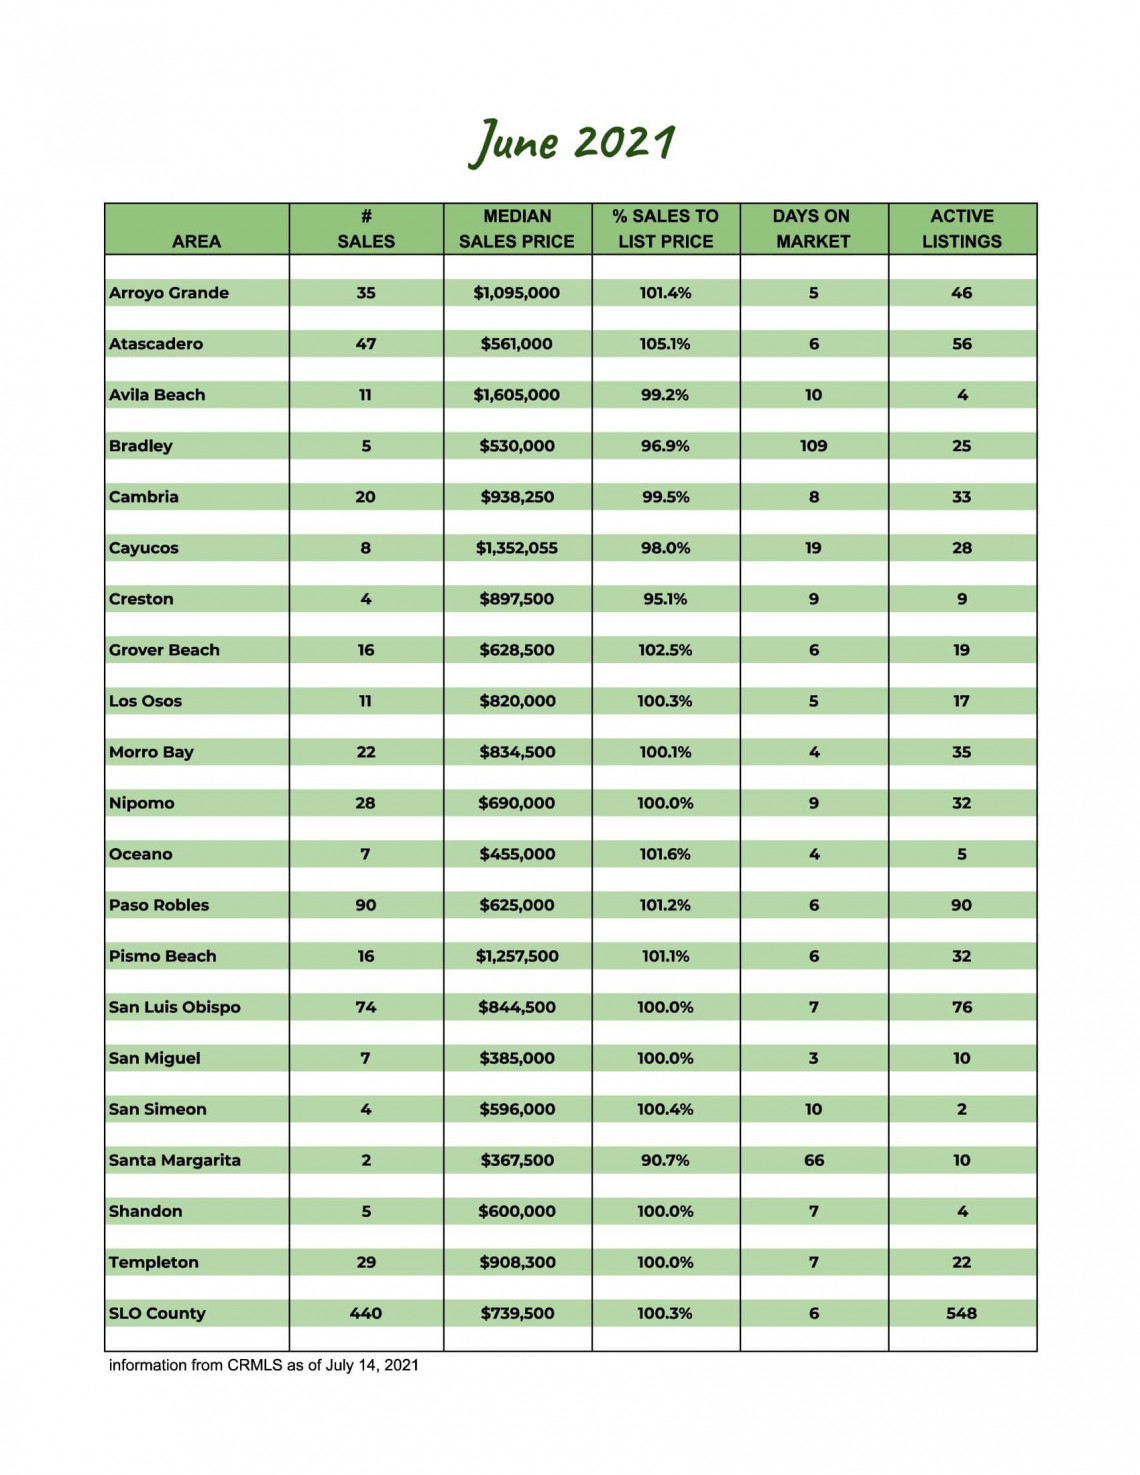
SAN LUIS OBISPO COUNTY MARKET UPDATE - JUNE 2021
While the number of new listings for last month (408) is up from the number of new listings for June of last year (379), it is still averaging 12% less than the previous five years' June averages of 457.
And while fewer property owners are choosing to sell, the buyer demand remains strong which keeps inventory historically low. The number of pending sales at the end of June (304) is lower than average but the number of closed sales (440) was significantly higher than the previous five years' June averages of 364.
The average sales price from June of 2020 to June of 2021 has increased a staggering 26.4%.
If you’re thinking about selling your home, it's important to have a good understanding of what’s going on in the market. Knowing the most important data such as the average sales price, number of homes sold, and days on market will better prepare you to sell your home.
Our market report showcases everything you need to know about local real estate trends so scroll down for more info.
408
New Listings
548
Active Listings
304
Under Contract
440
Closed Sales
Homes Sold
102.0%
Sale-to-List Price

$884,380
Average Sales Price

1.5
Months of Supply

18
Average Days on Market

$482
Average Price per Square Foot