Summer buyers are motivated. Here's what that means for your listing.
Read the Post 


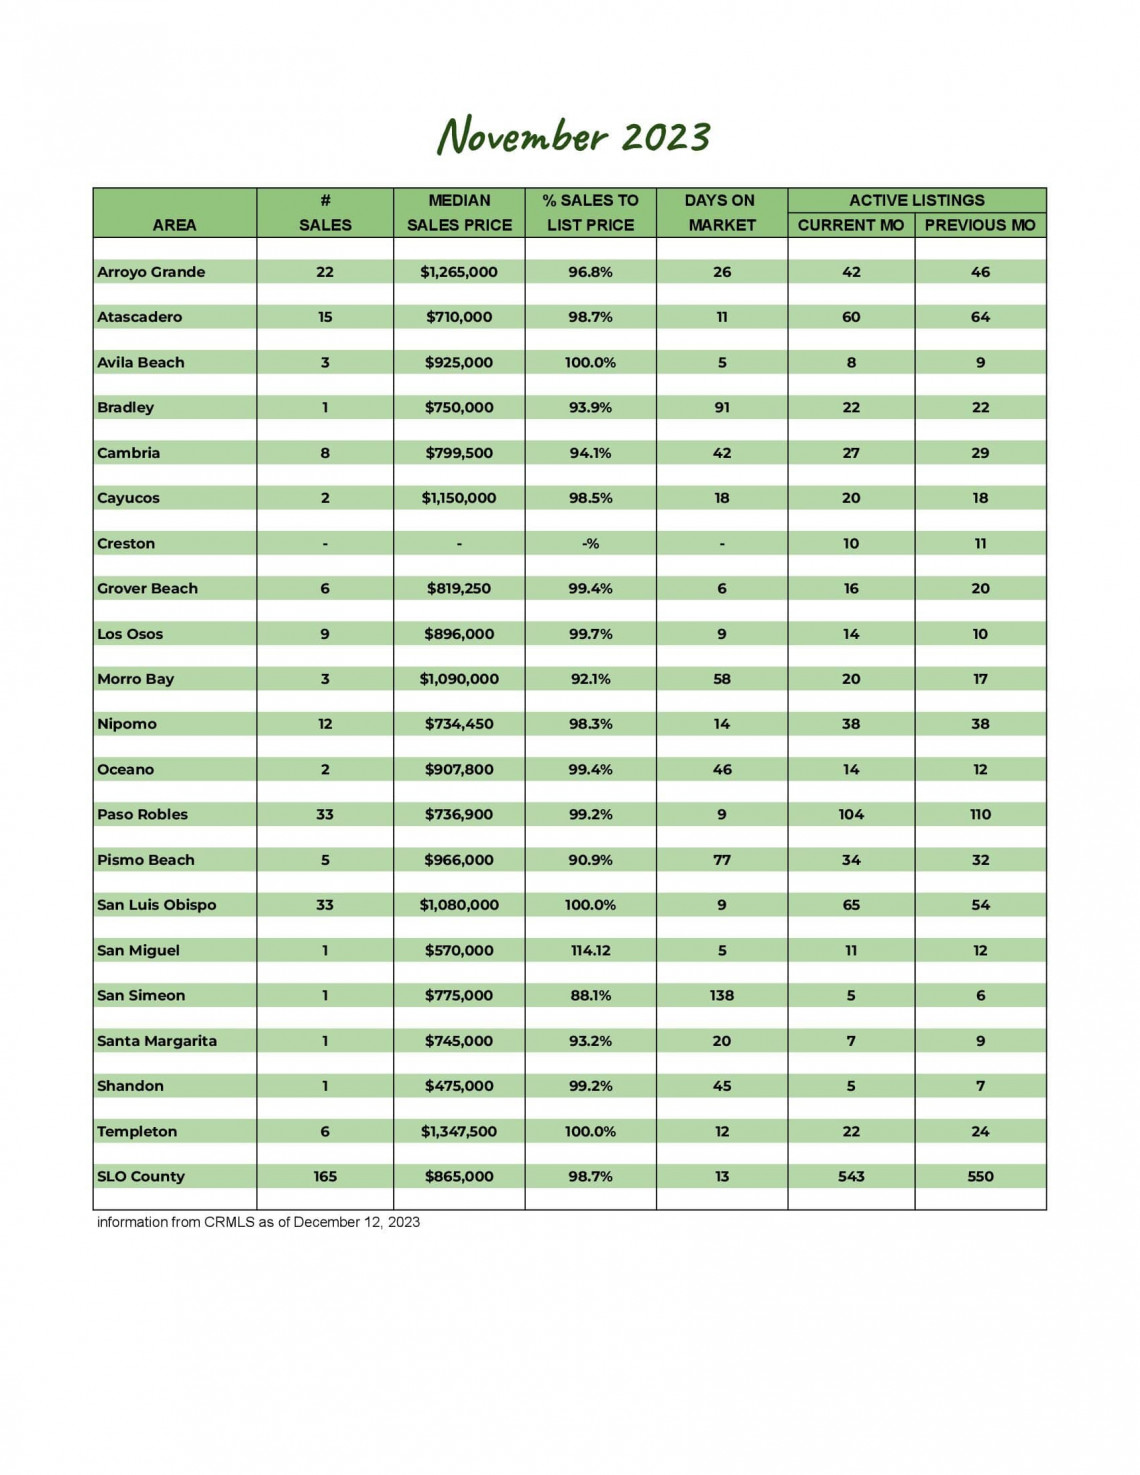
San Luis Obispo County November 2023 Market Update
Whether you're thinking of buying or selling a home, or just like to stay up to date on the real estate market, you need locally sourced, real data to keep you informed.
Knowing the most important data such as the average sales price, number of homes sold, and days on market will better prepare you for your real estate transaction.
The number of new listings is the same as last year but dropped 15.8% from last month. The number of pending and closed sales are down from last year and saw drops of 24.8% and 19.9% from last month. Yet the number of active listings and number of days on market are virtually the same as last month.
The average price is up 4.5% from last year. The average percentage of the sales price to list price slipped to 97.8%, while 43% of the homes sold for the list price or above.
Our market report showcases everything you need to know about each San Luis Obispo County community's real estate trends.
187
New Listings
2022: 188
543
Active Listings
2022: 617
124
Under Contract
2022: 150
165
Closed Sales
2022: 181
Homes Sold
97.8%
Sale-to-List Price
2022: 96.1%

$1,008,379
Avg Sales Price
2022: $965,257

2.7
Months of Supply
2022: 2.6

29
Avg Days on Market
2022: 33

$544
Avg Price per Sq Foot
2022: $521