San Luis Obispo County October 2024 Market Update
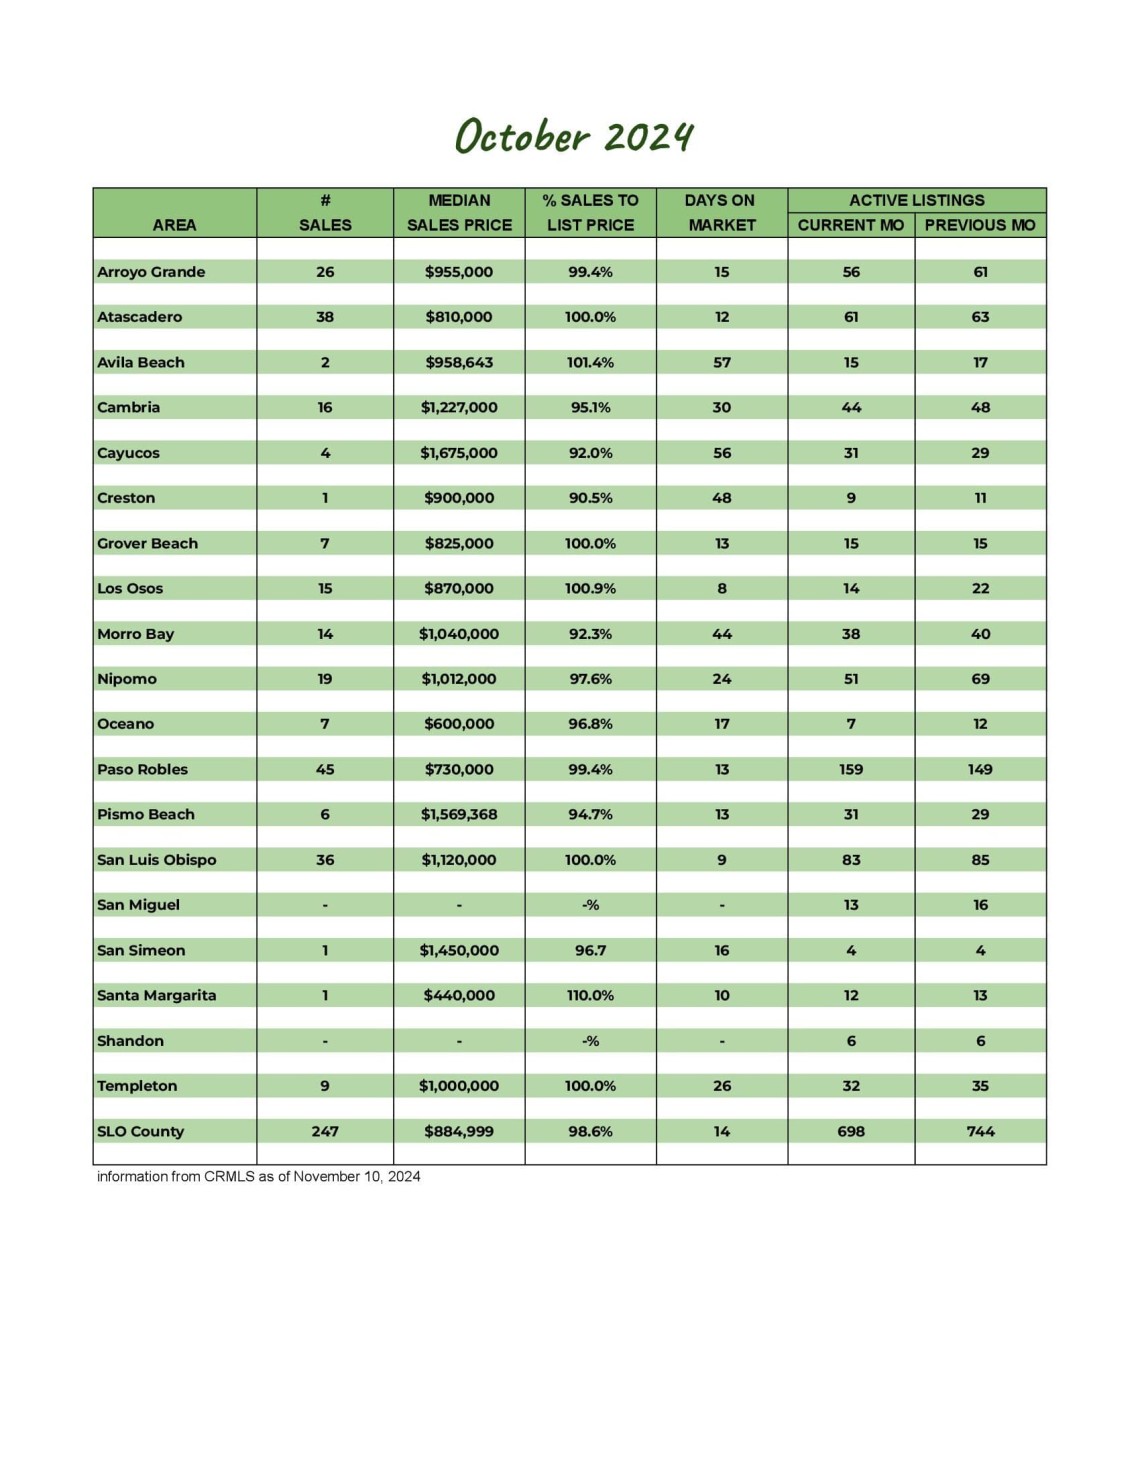
Whether you're considering buying or selling a home or simply staying informed about the local real estate scene, having access to the latest data is crucial. Our San Luis Obispo County market report provides a comprehensive look at current trends, helping you make well-informed decisions.
The current inventory jumped 15.6% from last year but dipped a bit from last month, partially due to the drop in new listings which decreased 21.9% from last month yet increased 10.6% for the same period last year. Pending sales are holding fairly steady, down 8.6% from last month and 3.6% from last year. Closed sales were up from both last month and October 2023.
The average sales price in San Luis Obispo County is up 7.9% from last year, while the average price per square foot is up 4.1%. The average percentage of the sales price to list price is 97.2%% and the median days on the market remains at fourteen..
Knowing the most important data such as the average sales price, number of homes sold, and days on market can significantly enhance your real estate strategy, whether you're buying or selling.
Our market report showcases everything you need to know about each San Luis Obispo County community's real estate trends.
228
New Listings
2023: 255
698
Active Listings
2023: 604
187
Under Contract
2023: 194
247
Closed Sales
2023: 208
Homes Sold
97.2%
Sale-to-List Price
2023: 98.2%
$1,038,224
Avg Sales Price
2023: $9652,437
3.3
Months of Supply
2023: 3.0
38
Avg Days on Market
2023: 28
$578
Avg Price per Sq Foot
2023: $555


