Summer buyers are motivated. Here's what that means for your listing.
Read the Post 


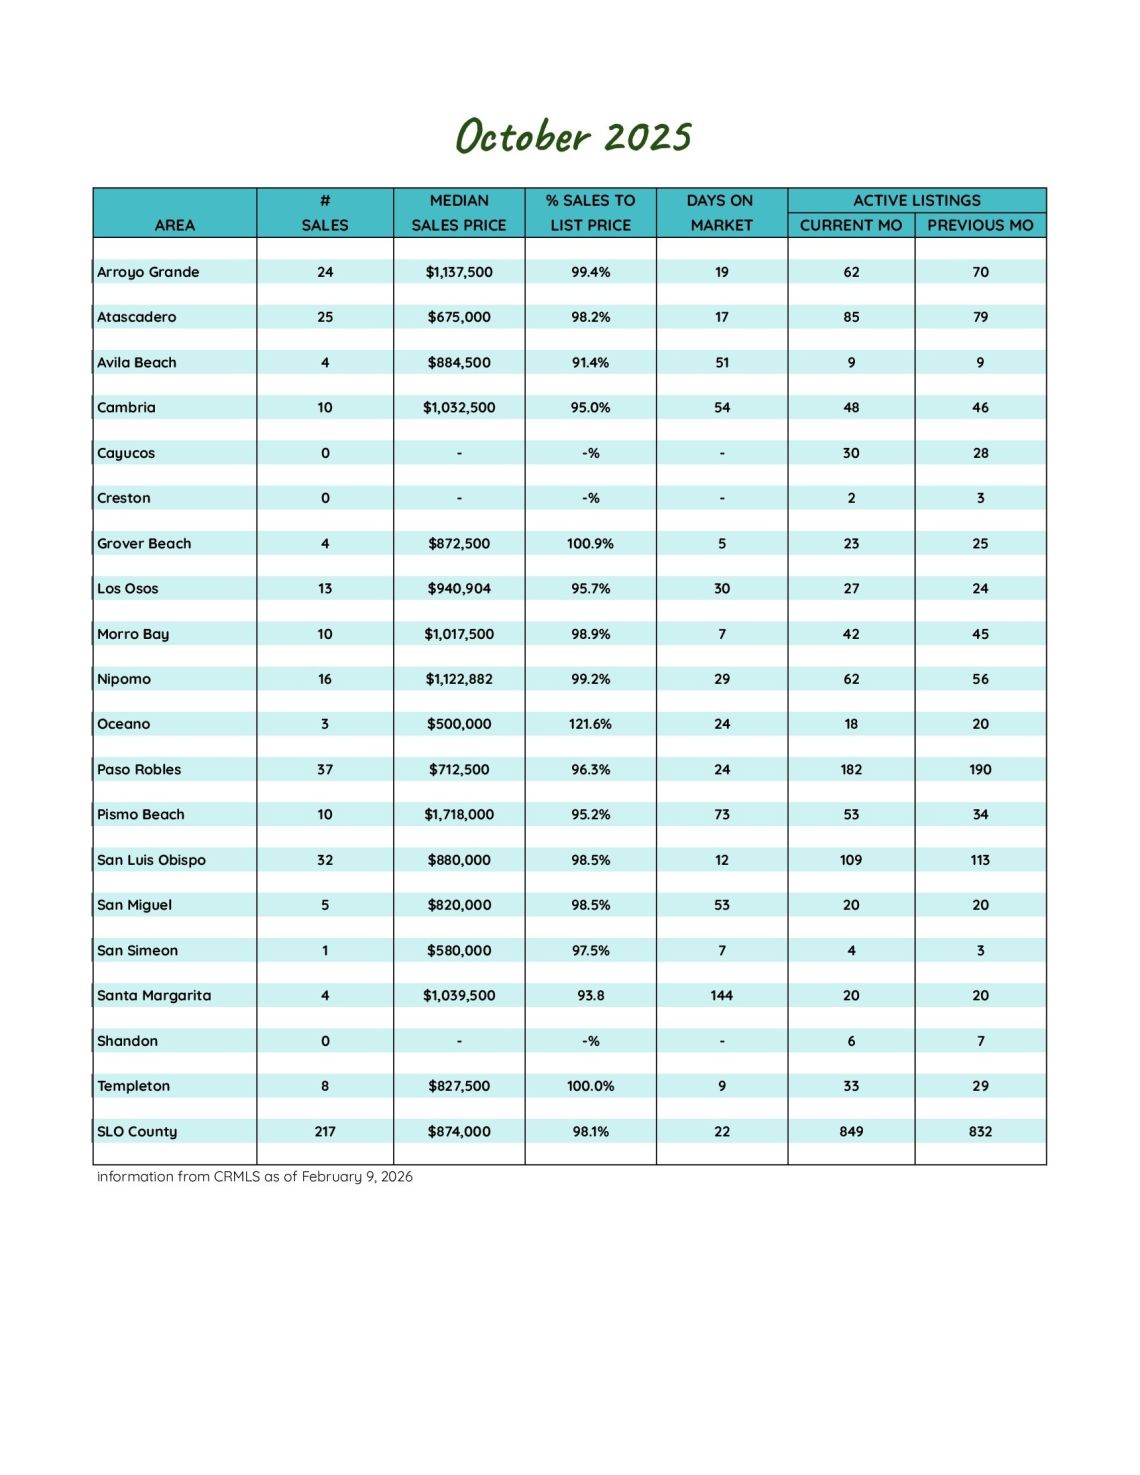
San Luis Obispo County October 2025 Market Update
Inventory Expands Year-Over-Year as Sales and Prices Ease
As fall settles across San Luis Obispo County, the housing market is showing signs of recalibration. October’s data reflects increased listing activity compared to last year, softer closings, and a noticeable cooling in pricing. While inventory remains healthier than in 2024, buyers are taking more time and negotiating more aggressively, creating a balanced and more measured market environment.
Inventory Trends: New Listings Rise, Supply Holds Balanced
October brought 285 new listings to the market, up 3.6% from September and 13.1% higher than October 2024. Sellers appear more confident heading into the fourth quarter, contributing to stronger year-over-year supply.
Active listings totaled 849, down slightly from September’s 879 but 12.9% above last year’s 752. Months of supply registered at 3.9, nearly unchanged from September’s 4.0 but up 11.4% from 3.5 one year ago. These figures point to a market that remains balanced, offering buyers more choice than last fall while avoiding oversupply conditions.
Sales Activity: Pending Stable, Closings Decline
Buyer demand remained steady but subdued. Pending sales reached 225 in October, down just 1.3% from September and nearly identical to October 2024’s 224. This suggests that while buyers are active, they are proceeding cautiously.
Closed sales, however, dropped to 217, down 14.2% month-over-month and 12.1% compared to last year. The slowdown in closings reflects softer contract activity in late summer and indicates that overall momentum has moderated.
Pricing and Market Pace: Negotiation Increases as Homes Take Longer to Sell
Pricing metrics reveal a mixed picture. The average sales price declined to $987,273, down 4.5% from September and 4.9% year-over-year. However, price per square foot rose to $587, up 1.9% from last month and 1.6% from October 2024, suggesting shifts in the size and composition of homes sold rather than broad price erosion.
The list-to-sale price ratio softened to 95.8%, compared to 96.5% in September and 97.2% a year ago, signaling greater negotiating power for buyers. Homes also spent more time on the market, averaging 47 days — up from 40 last month and 38 last October.
Together, these indicators point to a market that is no longer accelerating but stabilizing into a steady, balanced rhythm.
What It Means for Buyers and Sellers
For sellers, strategic pricing and strong presentation are increasingly critical. Buyers have more options and more leverage than they did a year ago, and overpricing can lead to extended market times.
For buyers, expanded inventory and softer pricing trends offer opportunity — particularly as negotiation flexibility improves. However, well-positioned homes in desirable locations continue to attract attention.
As we move deeper into fall, San Luis Obispo County’s housing market appears balanced and steady — less competitive than in recent years, yet still fundamentally healthy.
285
New Listings
2024: 252
849
Active Listings
2024: 755
225
Under Contract
2024: 224
217
Closed Sales
2024: 247
Homes Sold
95.8%
Sale-to-List Price
2024: 97.2%

$987,273
Avg Sales Price
2024: $1,038,224

3.9
Months of Supply
2024: 3.5

47
Avg Days on Market
2024: 38

$587
Avg Price per Sq Foot
2024: $578