Summer buyers are motivated. Here's what that means for your listing.
Read the Post 


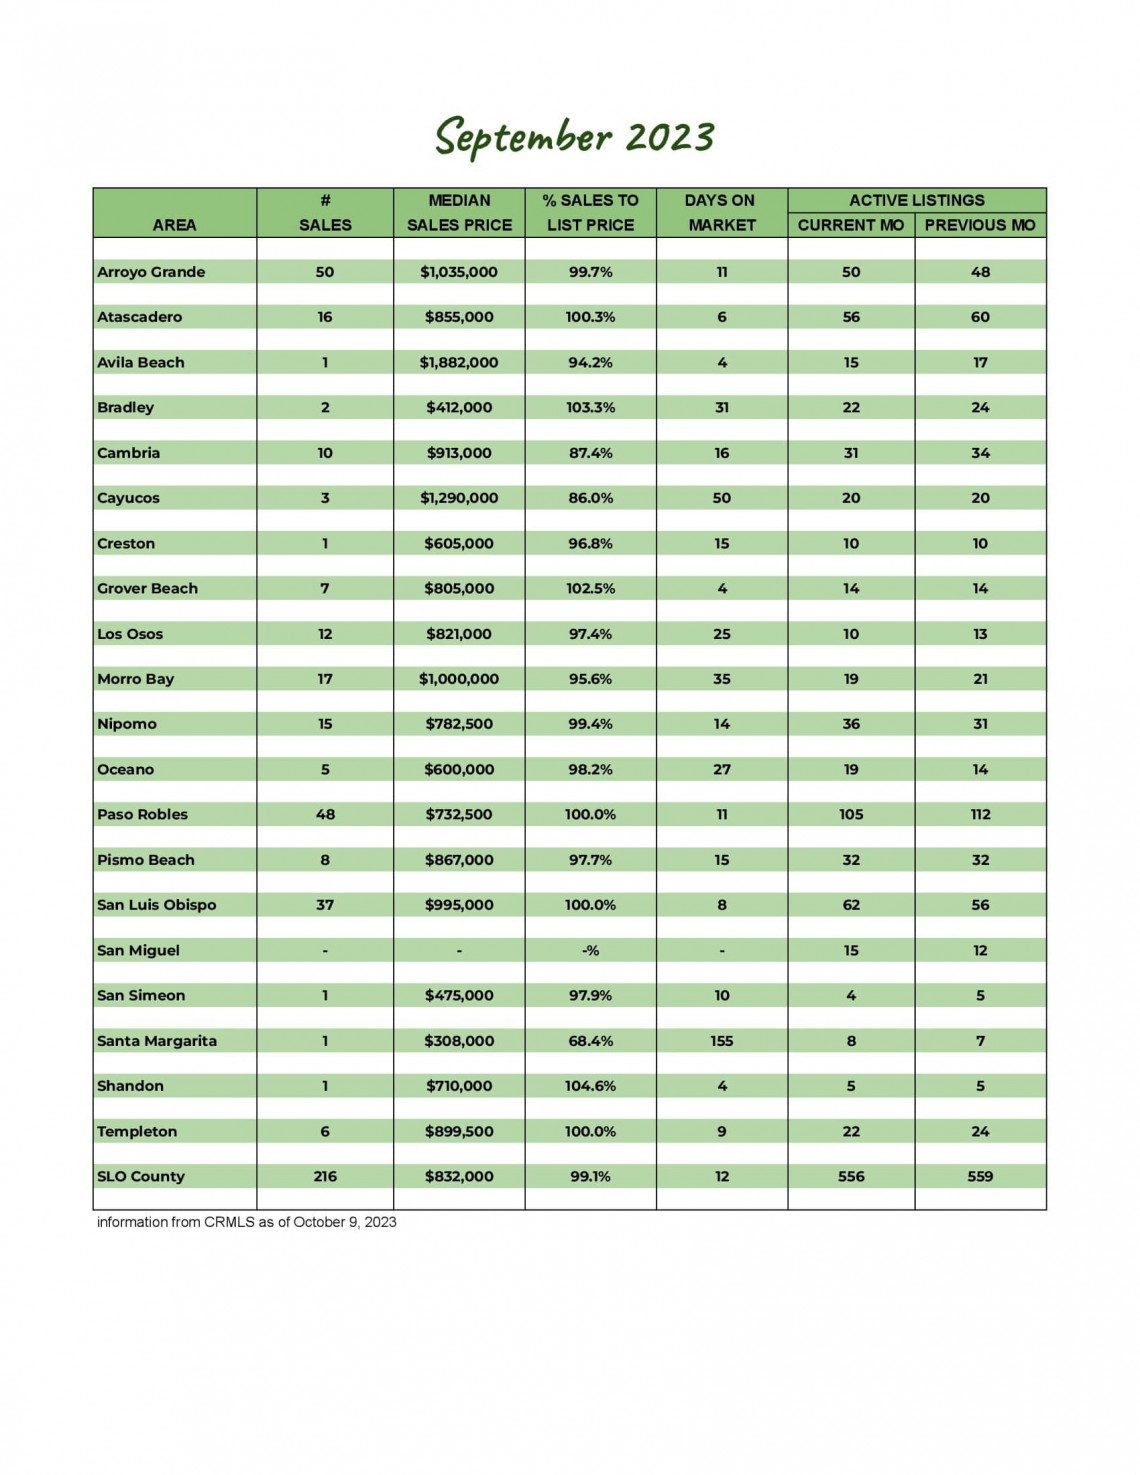
San Luis Obispo County September 2023 Market Update
Whether you're thinking of buying or selling a home, or just like to stay up to date on the real estate market, you need locally sourced, real data to keep you informed.
Knowing the most important data such as the average sales price, number of homes sold, and days on market will better prepare you for your real estate transaction.
The September average sales price is up 1.21% from last month, but nearly the same as September of last year.
The number of new listings are down 25% from last month. Current inventory, pending, and closed sales saw almost no change. All are down from September of last year.
The average percentage of the sales price to list price dipped to 97.2%, as well over half of the sales sold for less than the list price.
Our market report showcases everything you need to know about each San Luis Obispo County community's real estate trends.
216
New Listings
2022: 260
556
Active Listings
2022: 652
160
Under Contract
2022: 217
216
Closed Sales
2022: 273
Homes Sold
97.2%
Sale-to-List Price
2022: 96.3%

$968,152
Avg Sales Price
2022: $967,075

2.8
Months of Supply
2022: 2.5

32
Avg Days on Market
2022: 31

$562
Avg Price per Sq Foot
2022: $520