Summer buyers are motivated. Here's what that means for your listing.
Read the Post 


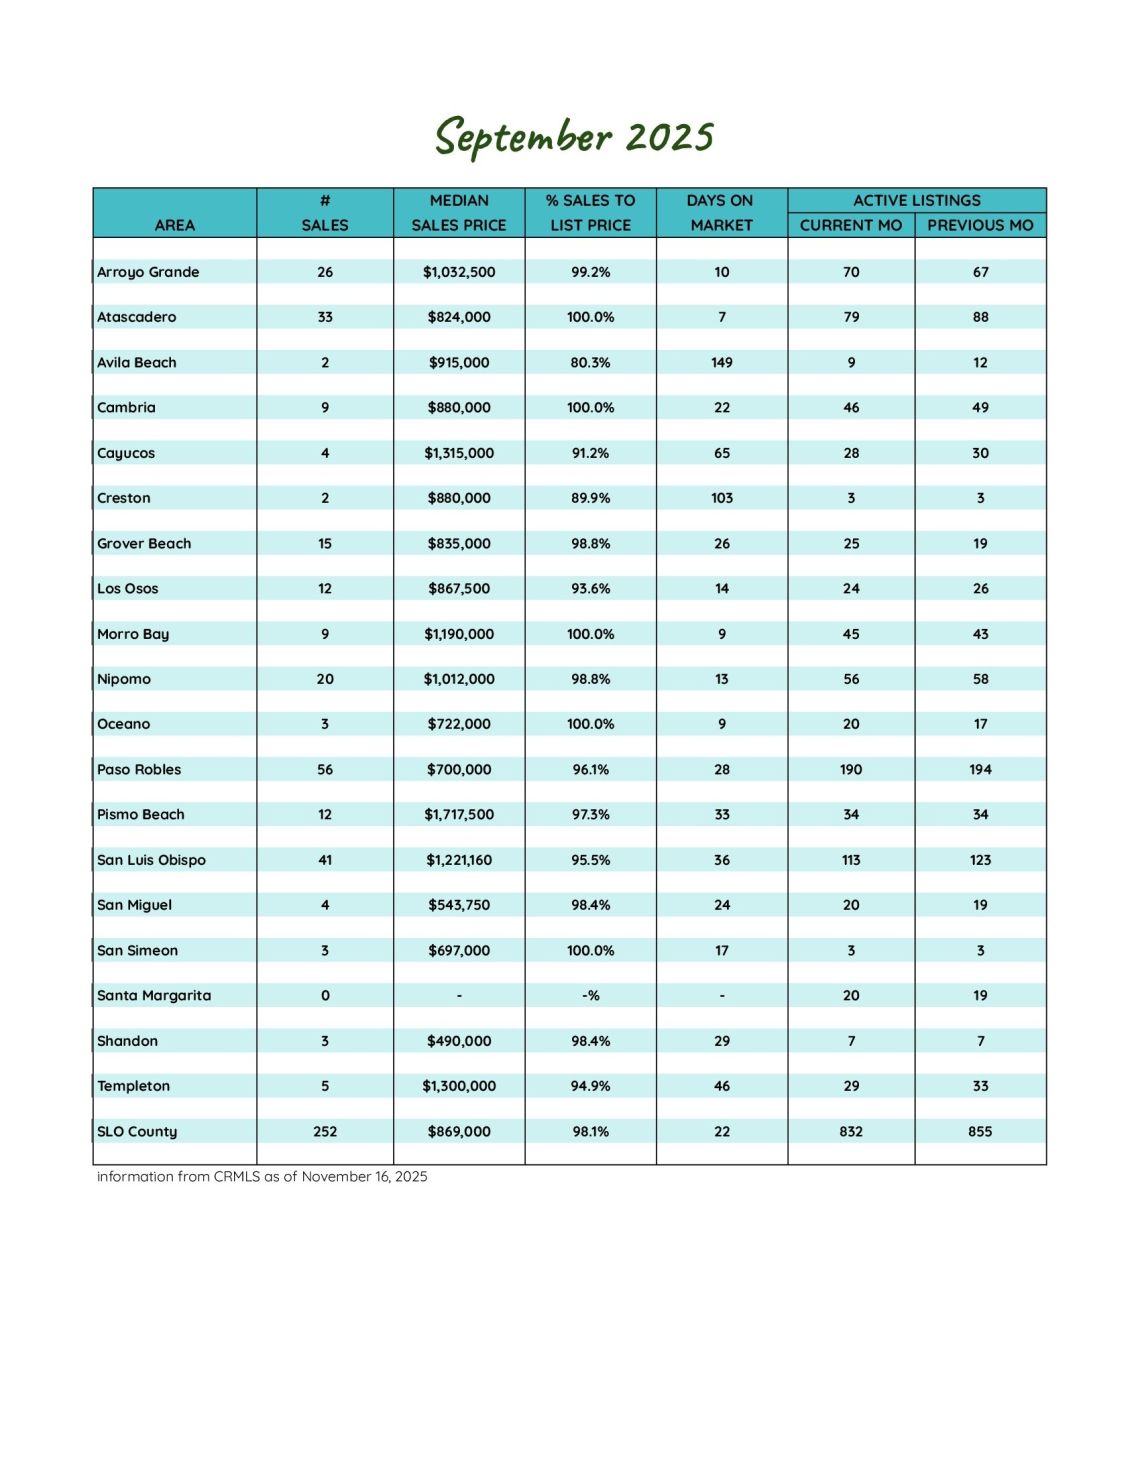
San Luis Obispo County September 2025 Market Update
Sales Hold Steady as Inventory Tightens and Pricing Moderates
As summer fades into early fall, the San Luis Obispo County housing market is settling into a more deliberate rhythm. September’s numbers reflect a market that is neither surging nor stalling—but recalibrating. Inventory has tightened modestly, sales activity remains resilient, and pricing is showing short-term softening while holding firm year over year.
Inventory Trends: Fewer New Listings, Still More Choice Than Last Year
New listing activity slowed in September, with 270 homes coming to market—down from August and trailing last year’s pace. This seasonal pullback suggests many sellers are choosing to wait rather than test the market heading into fall.
Active inventory also dipped slightly month to month, yet remains higher than it was a year ago. With 832 active listings countywide and 3.8 months of supply, buyers still have more options than they did last September, though the market is no longer expanding at the pace seen earlier this year.
Sales Activity: Closings Rise as Buyers Stay Selective
Buyer behavior continues to show a split personality. Pending sales declined from August, reflecting increased caution and longer decision timelines. However, closed sales moved higher—posting gains both month over month and year over year—suggesting solid follow-through on deals already in the pipeline.
Homes are taking longer to sell overall, with average days on market rising to 40. Yet, nearly one-third of homes sold within 10 days, reinforcing a familiar theme: standout properties are still moving quickly, while others require price adjustments and patience.
Pricing: Short-Term Cooling, Long-Term Strength
Pricing trends in September tell a nuanced story. The average sales price slipped from August but remains more than 10% higher than a year ago. Similarly, price per square foot edged down slightly month to month while continuing its gradual upward trajectory year over year.
Negotiation leverage has clearly shifted. The average list-to-sale price ratio improved from August but remains below last year’s level, as 38% of homes sold at or above asking price. Buyers have more room to negotiate, especially outside the most desirable neighborhoods.
Market Segmentation: A Tale of Many Markets
San Luis Obispo County continues to reflect wide variation by community and price point. Seven of the county’s nineteen communities posted median sales prices above $1 million, while four remained under $750,000—offering a range of opportunities depending on budget and lifestyle.
At the luxury end, activity remained steady with 16 sales above $2 million, including a $4.35 million sale in Cayucos. High-end buyers are still active, though transactions appear more intentional and less frenzied than in past years.
The Takeaway
September’s data points to a market finding its footing. Inventory has tightened slightly, prices are adjusting modestly, and buyers are taking a more thoughtful approach. For sellers, strategic pricing and presentation matter more than ever. For buyers, increased choice and negotiation power are creating opportunities—especially for those prepared to act quickly when the right home appears.
270
New Listings
2024: 286
832
Active Listings
2024: 781
222
Under Contract
2024: 213
252
Closed Sales
2024: 218
Homes Sold
96.5%
Sale-to-List Price
2024: 97.5%

$1,033,251
Avg Sales Price
2024: $933,853

3.8
Months of Supply
2024: 3.7

40
Avg Days on Market
2024: 34

$577
Avg Price per Sq Foot
2024: $568